Overview
This project demonstrates a realistic SOC-style log monitoring and investigation workflow using the ELK Stack (Elasticsearch, Logstash, Kibana). The goal was to understand how raw Linux SSH authentication logs are collected, parsed, indexed, and investigated, rather than relying on prebuilt alerts or managed SIEM platforms. This lab intentionally focuses on visibility and investigation, which is a core responsibility of SOC and Blue Team analysts.
What is ELK and Why It’s Used
The ELK Stack is commonly used in security operations to centralize and analyze logs:
- Elasticsearch stores and indexes log data for fast searching
- Logstash ingests and parses raw logs into structured events
- Kibana provides search, visualization, and investigation capabilities
For SSH monitoring, ELK allows analysts to:
- Search authentication failures quickly
- Identify repeated failed login attempts
- Spot brute-force or unauthorized access patterns
- Investigate activity over time using timelines
Lab Environment
Architecture
- macOS
- Hosted Elasticsearch and Kibana using Docker & Docker Compose
- Linux (Ubuntu)
- Generated SSH authentication logs
- Ran Logstash to forward logs to Elasticsearch
Log flow: Linux SSH logs → Logstash → Elasticsearch → Kibana → Investigation
Step-by-Step What I Built
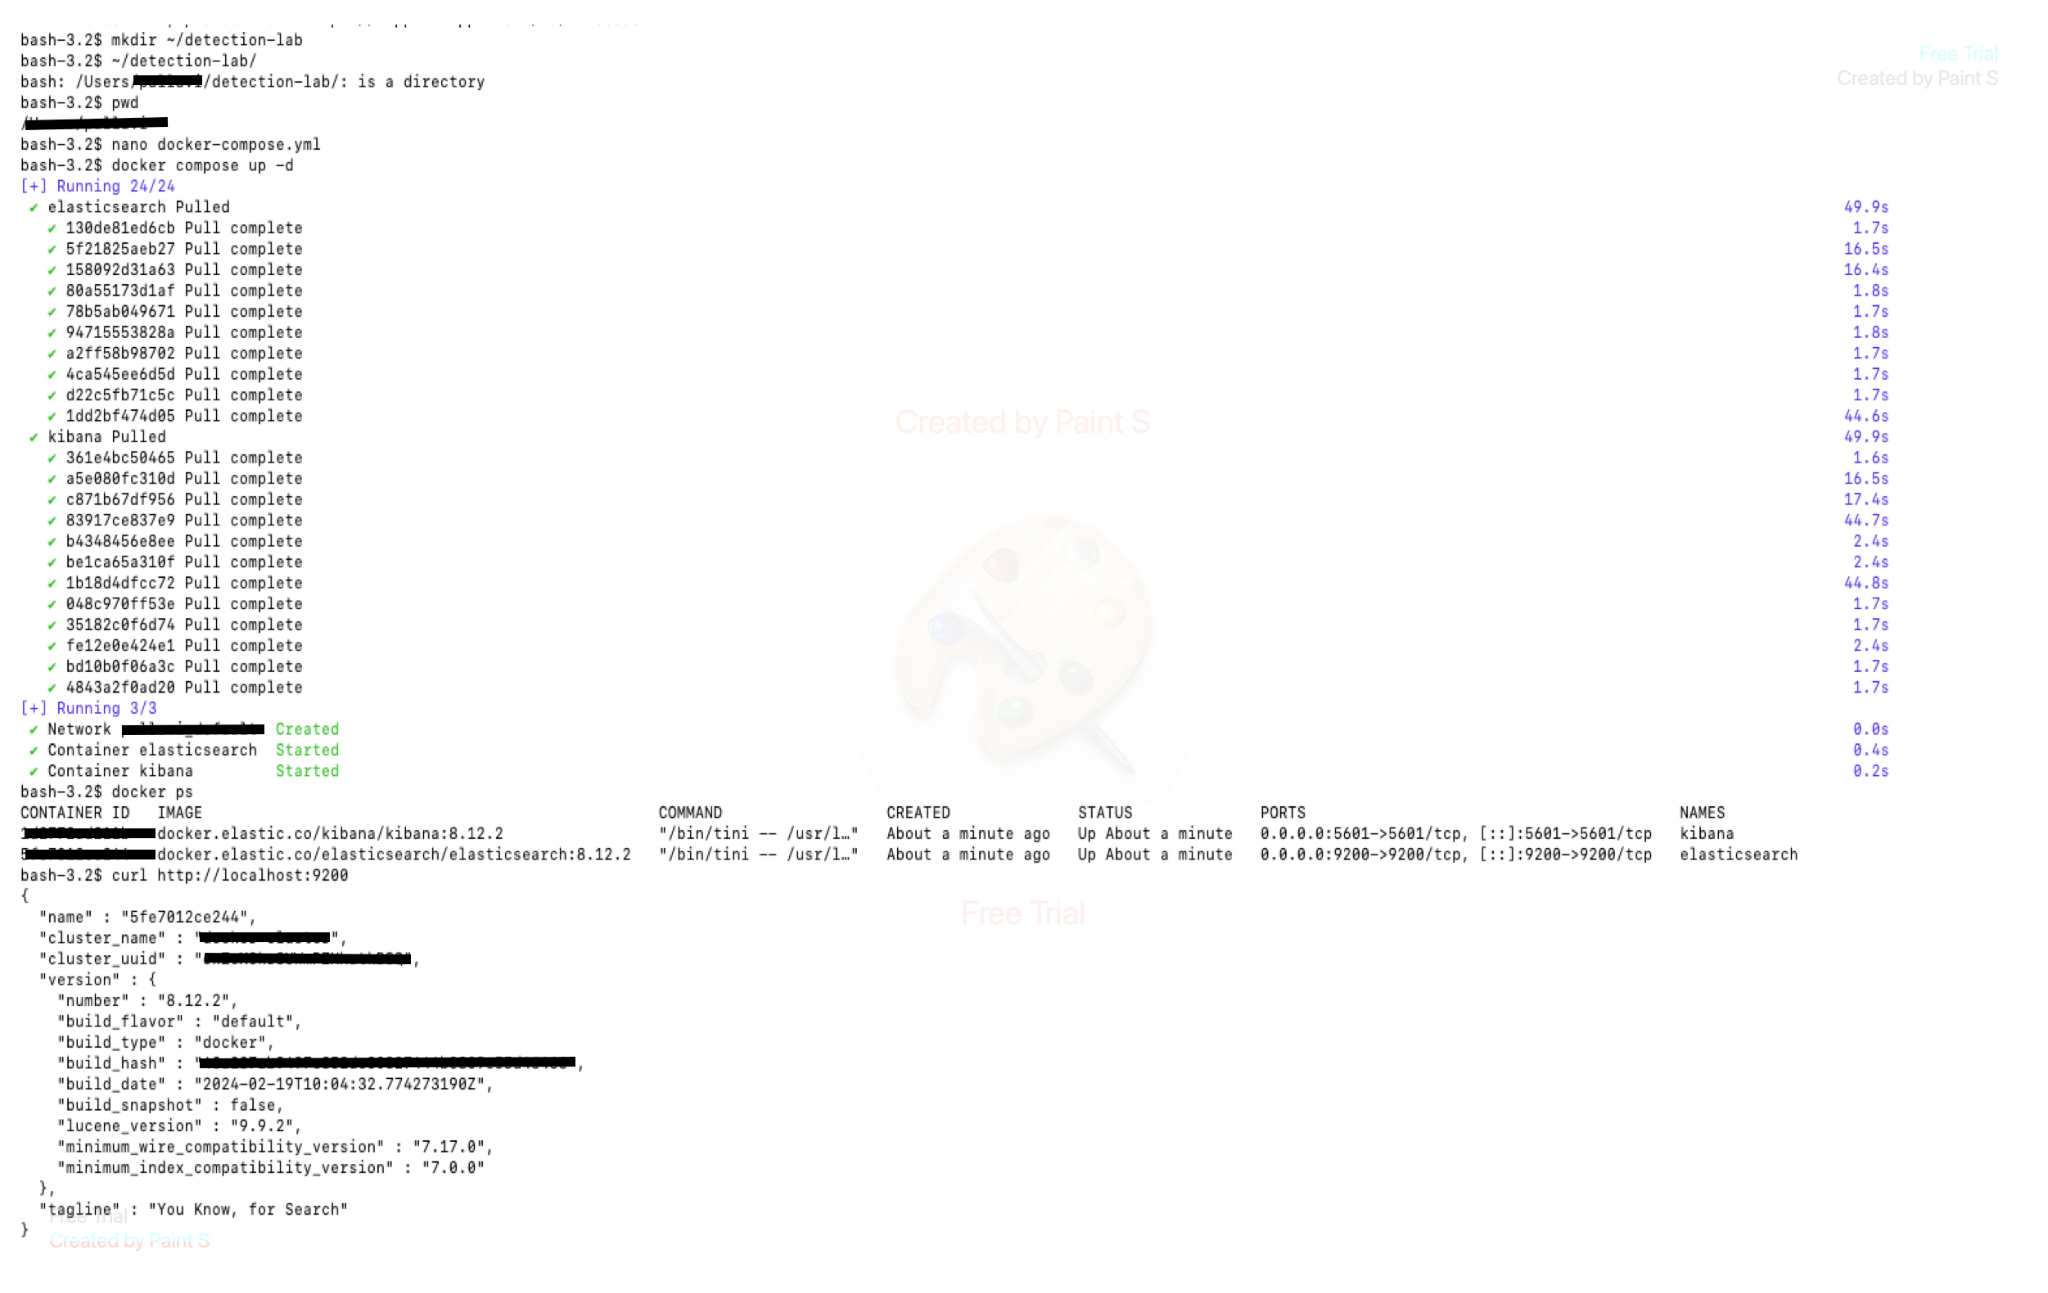
1. Deployed Elasticsearch and Kibana on macOS (Docker)
The ELK Stack was deployed locally on macOS using Docker Compose. Key components:
- Elasticsearch exposed on port
9200 - Kibana exposed on port
5601
Verification:
- Confirmed containers were running
- Verified Elasticsearch API accessibility
2. Generated SSH Authentication Logs on Linux
On the Ubuntu system, SSH authentication events were generated and written to: /var/log/auth.log
These logs included:
- Failed password attempts
- Invalid user login attempts
- Repeated authentication failures
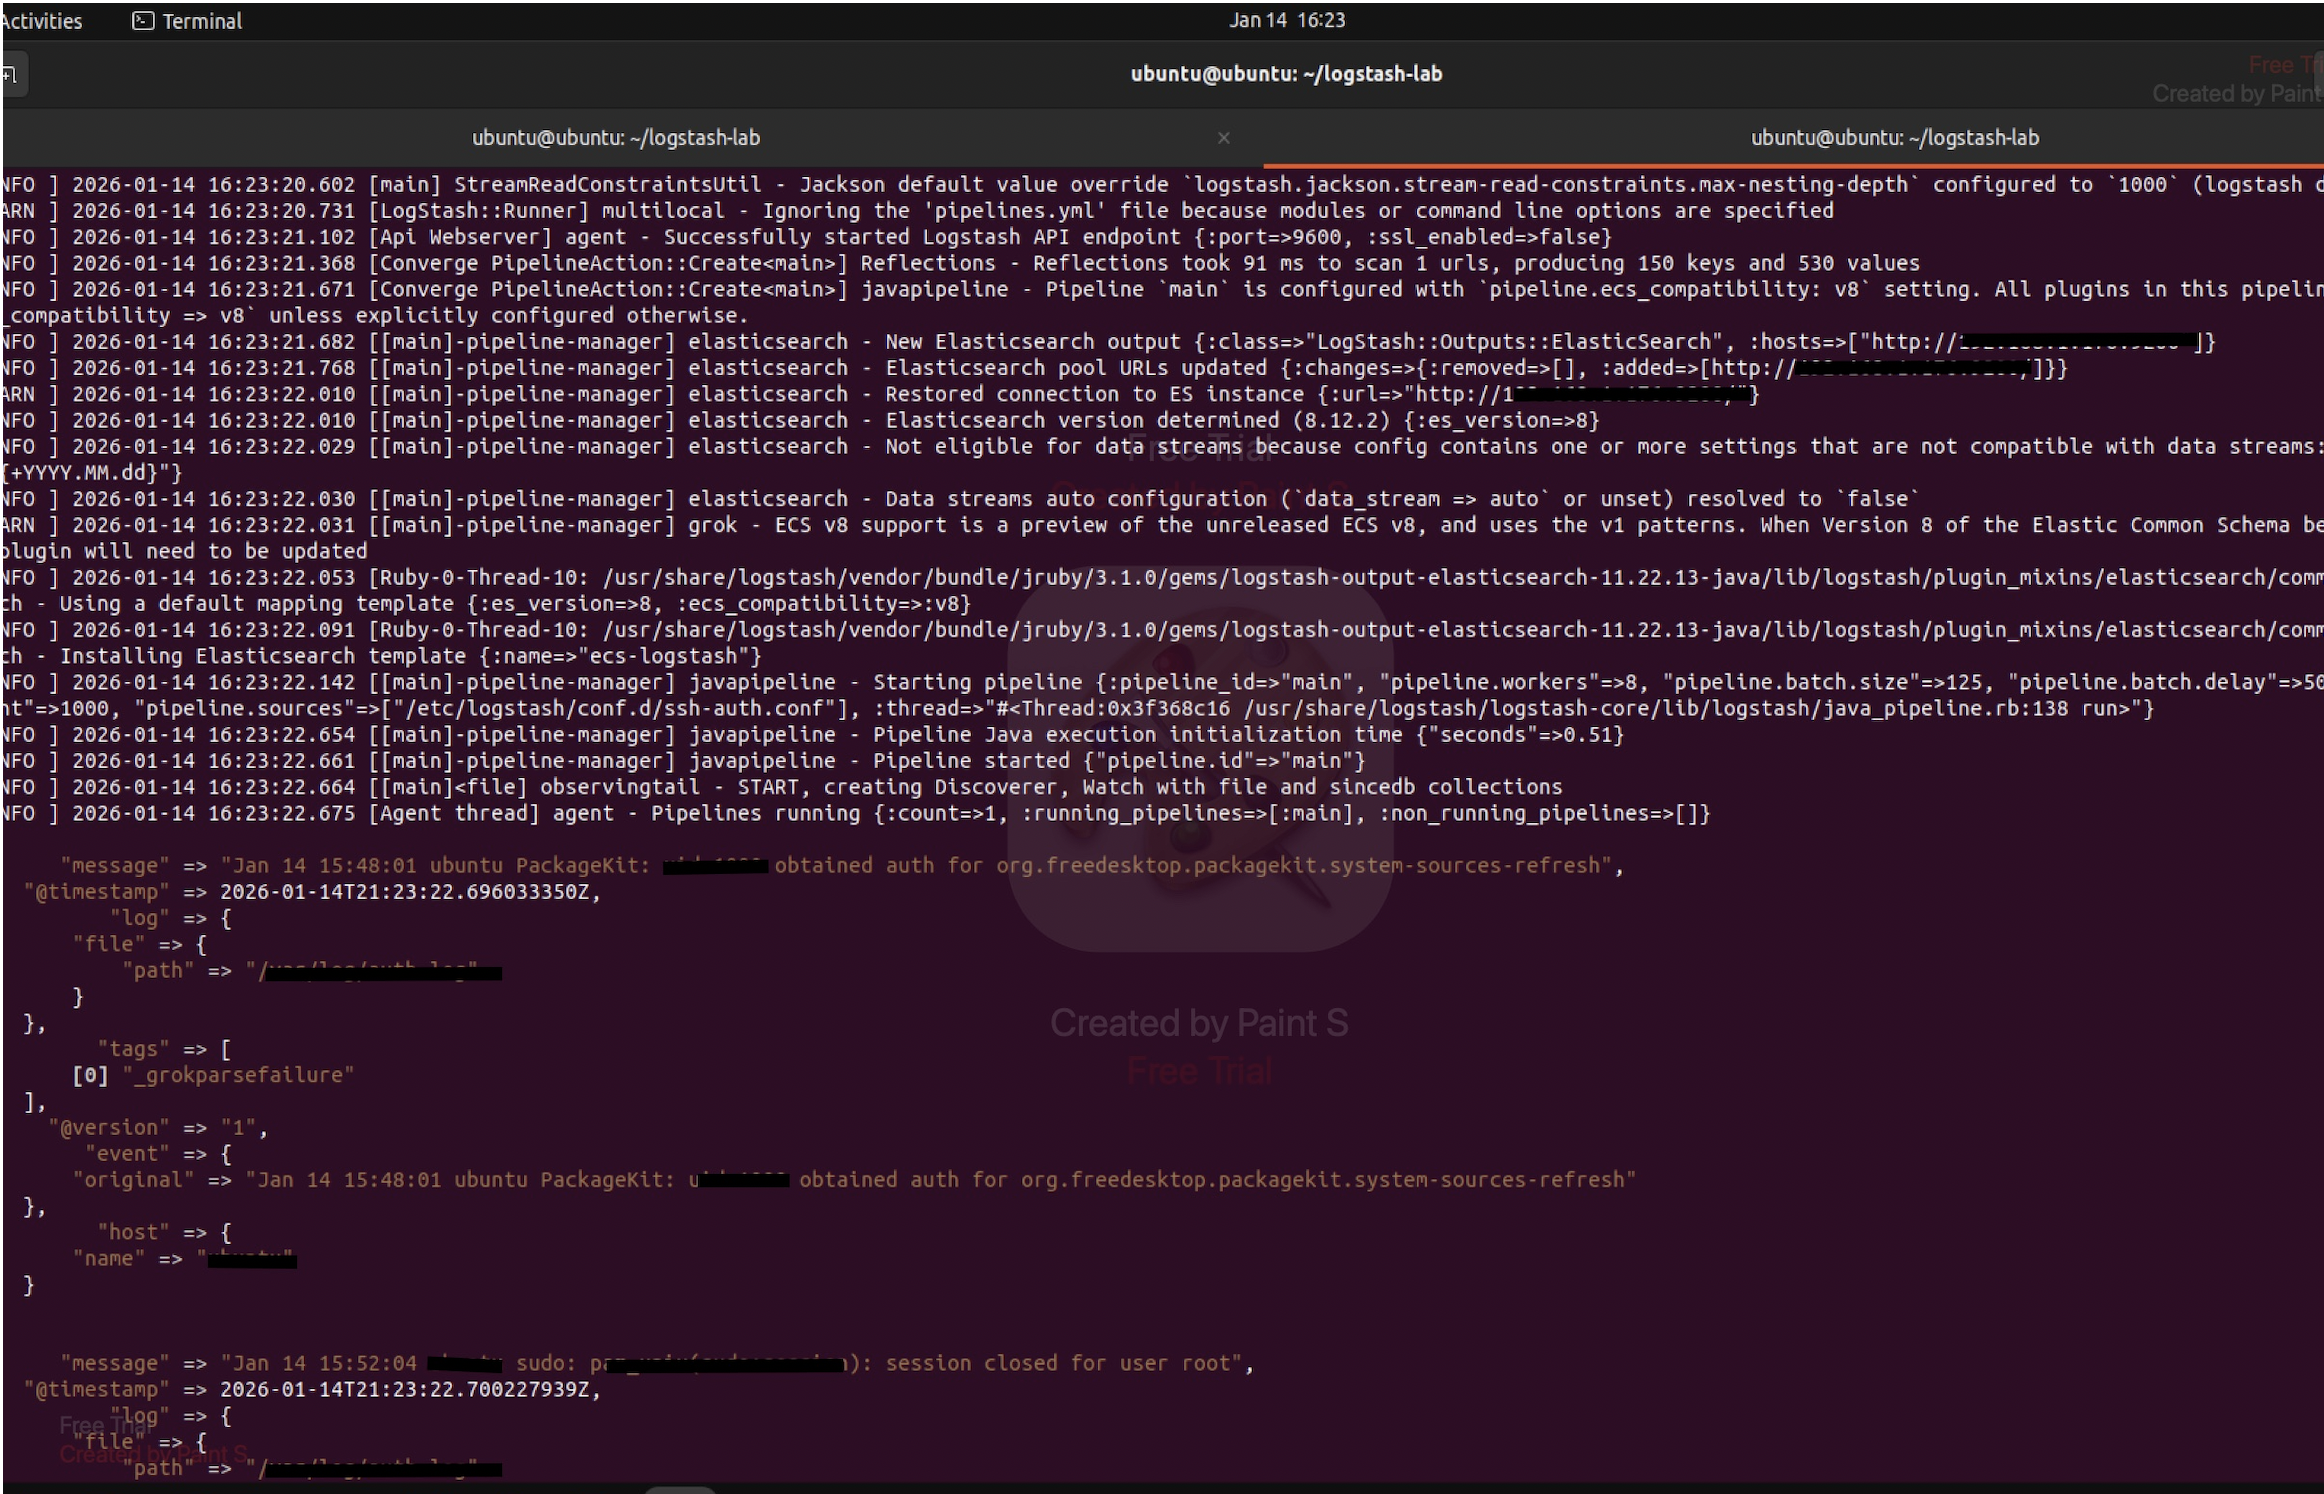
3. Ingested Logs Using Logstash
Logstash was configured on Linux to:
- Read SSH authentication logs
- Parse log messages
- Forward structured events to Elasticsearch
Logs were indexed using a time-based index pattern:
ssh-auth-YYYY.MM.DD
This enabled efficient searching and time-based analysis.
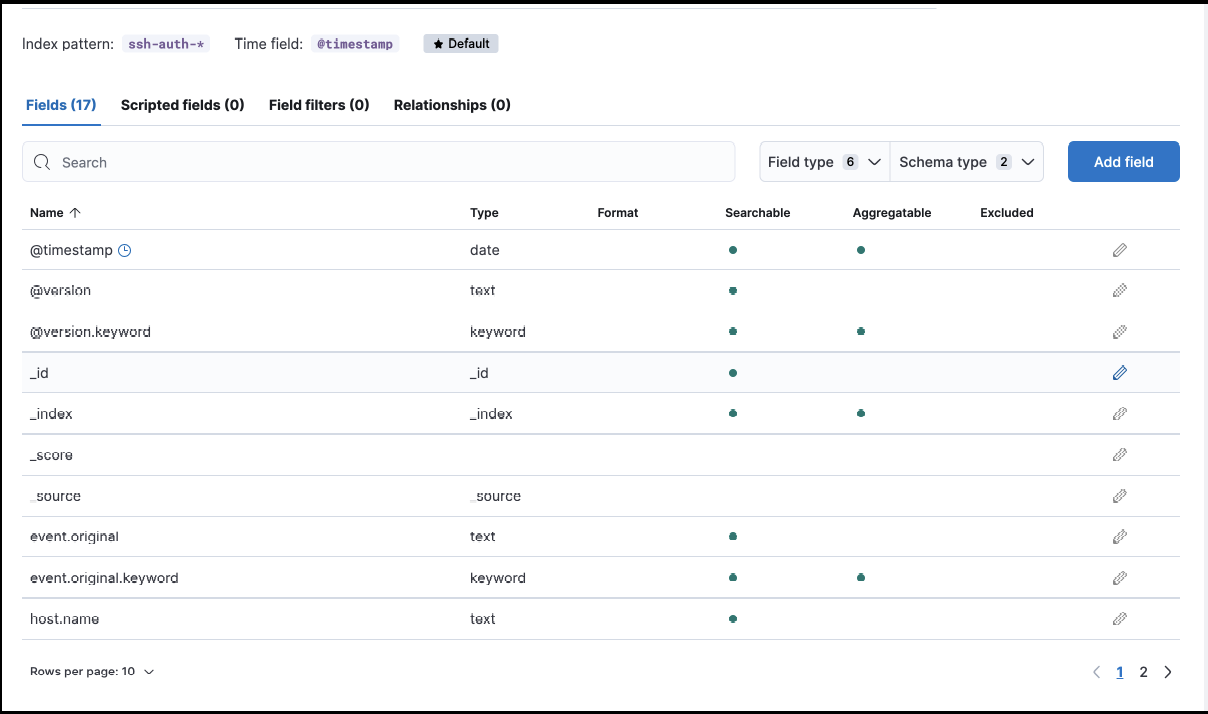
4. Verified Indexing in Elasticsearch
After ingestion:
- SSH logs appeared in Elasticsearch indices
- Index health and document counts were validated
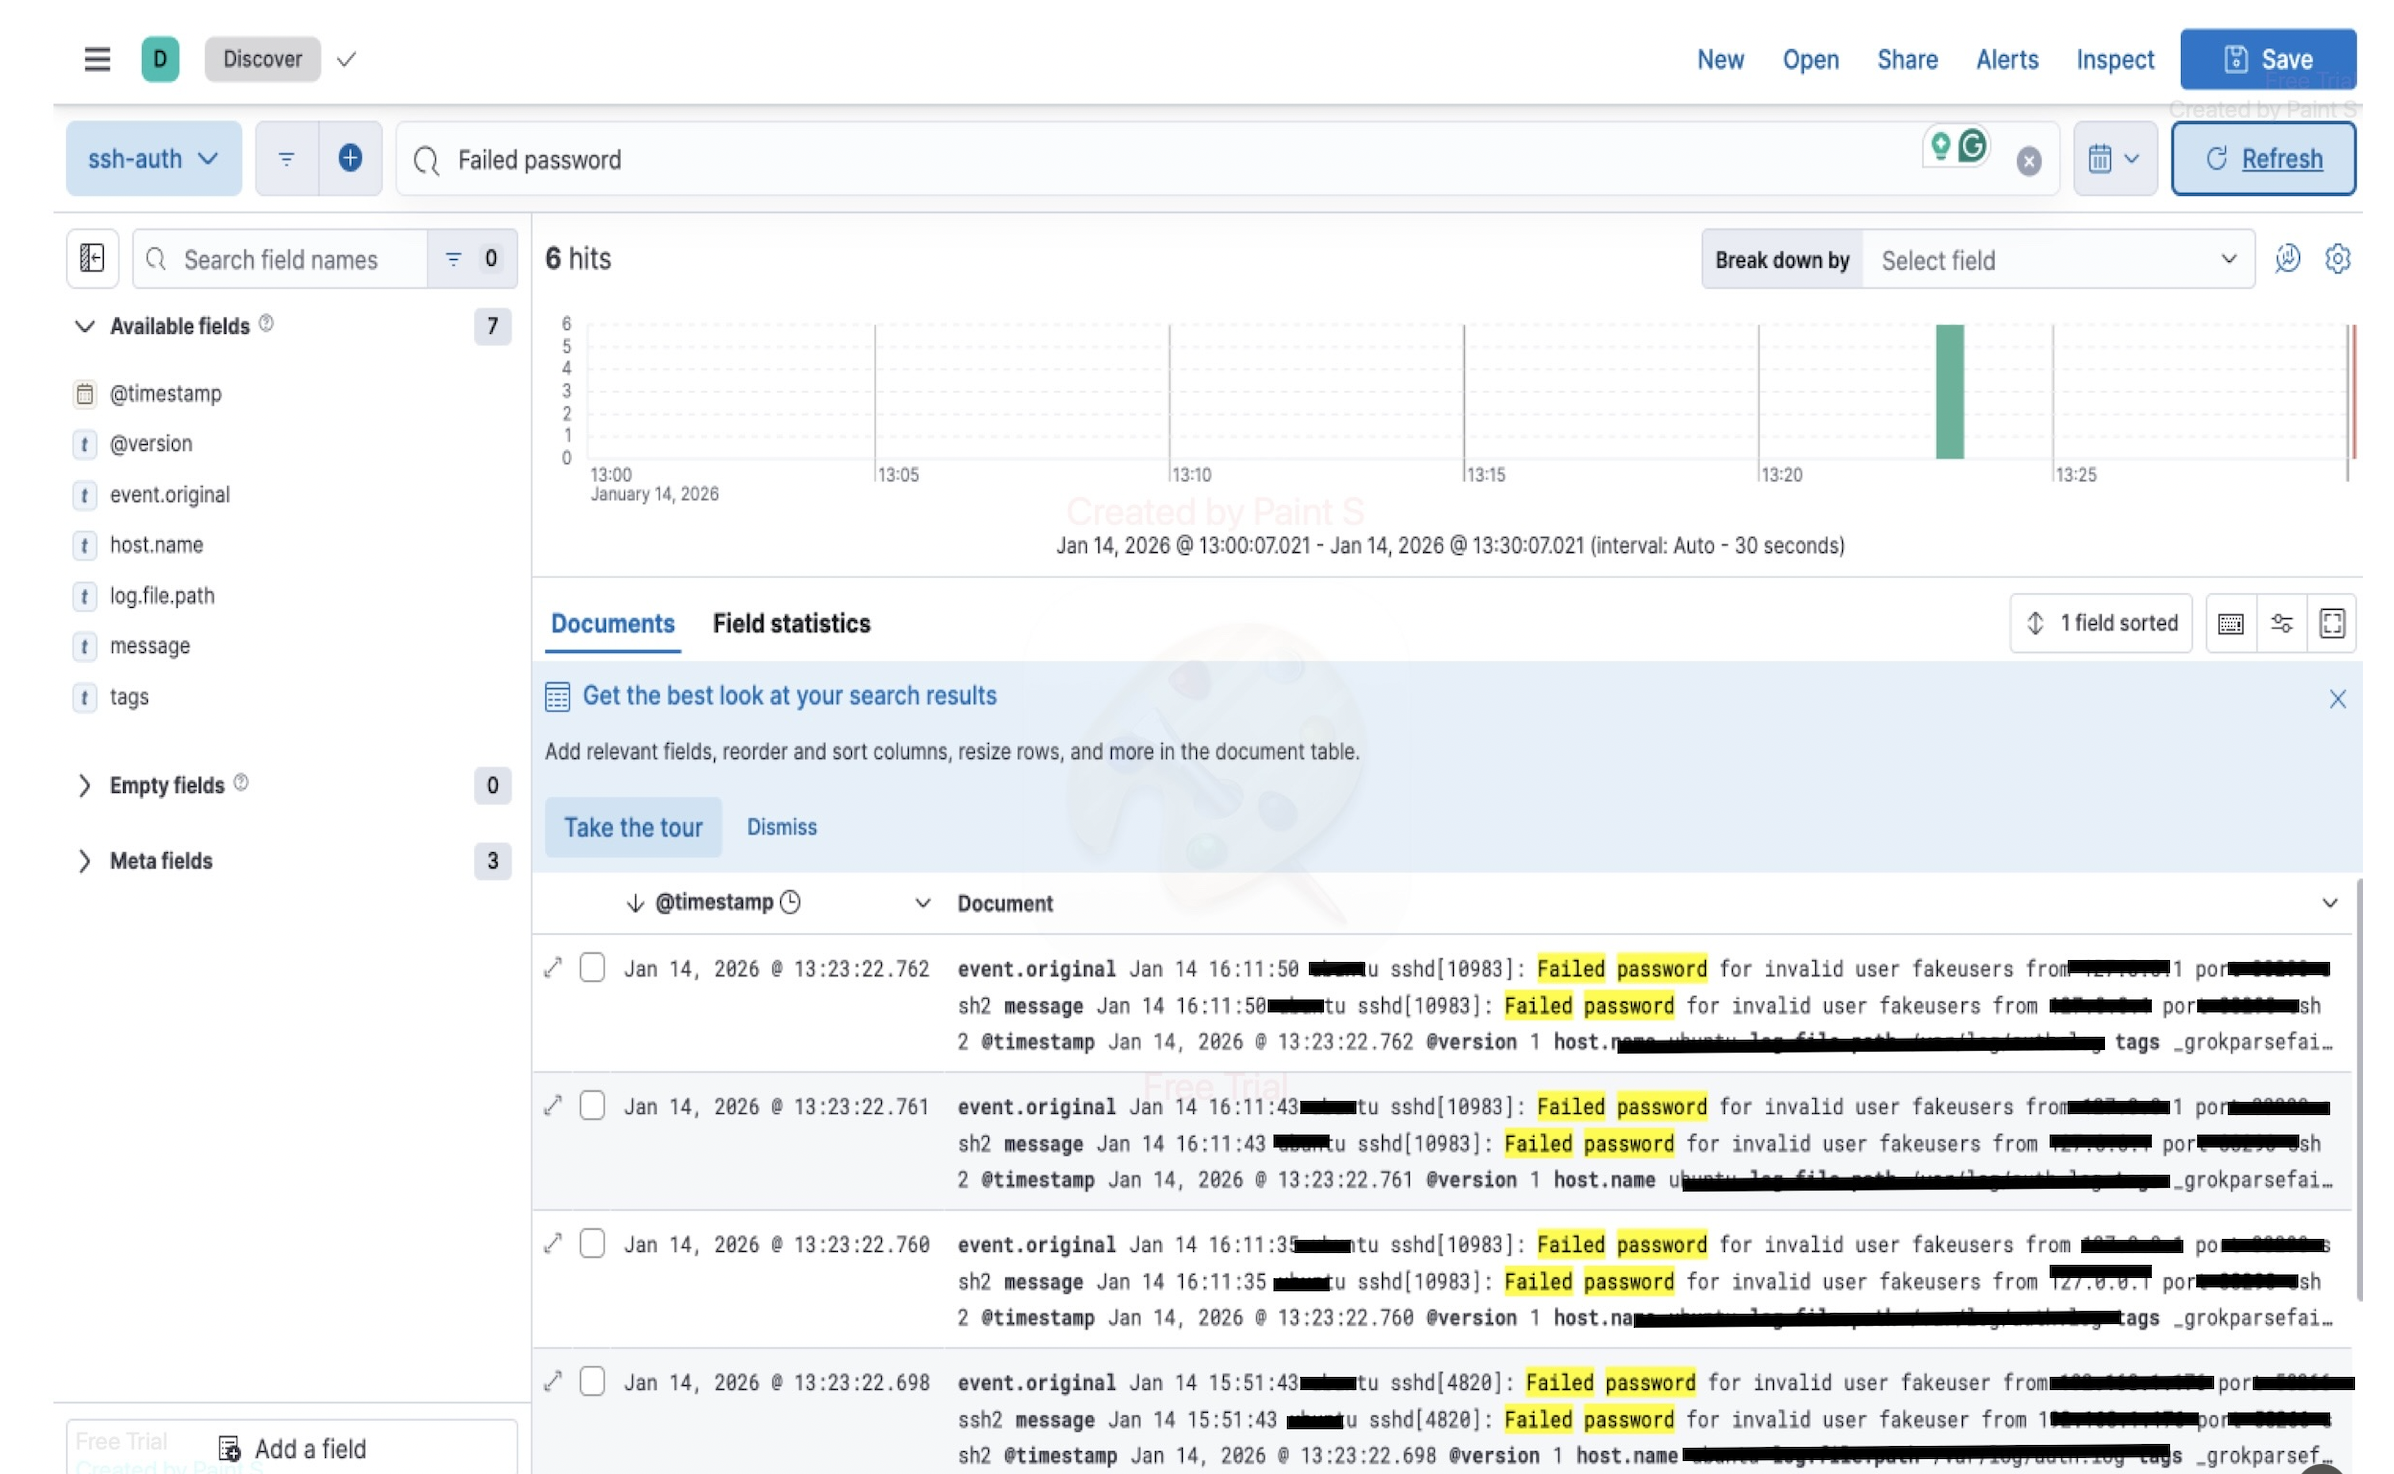
5. Investigated Logs Using Kibana Discover
Kibana Discover was used to investigate SSH activity by filtering for: “Failed password” This allowed inspection of:
- Failed login attempts
- Invalid user activity
- Source patterns over time
 —
—
6. Timeline & Pattern Analysis
Using Kibana’s timeline view, authentication failures were analyzed to:
- Identify bursts of failed login attempts
- Observe repeated failures from the same source
- Understand how brute-force behavior appears in logs
Investigation Focus (SOC Perspective)
This project mirrors how SOC analysts work when:
- Alerts are not yet configured
- Suspicious activity must be identified manually
- Analysts rely on log context and timelines
Instead of automated rules, the focus was on:
- Searching raw events
- Understanding log structure
- Correlating activity over time
Tools & Technologies Used
- Elasticsearch
- Logstash
- Kibana
- Docker & Docker Compose
- Linux (Ubuntu)
- SSH authentication logs
Key Learnings
- Understood how SSH attacks appear in raw Linux logs
- Gained hands-on experience building and troubleshooting an ELK pipeline
- Learned how logs move from ingestion to investigation
- Practiced SOC-style log analysis without prebuilt detections
- Strengthened understanding of centralized logging architectures
 Network Vulnerability Scanner using Python + Nmap
